What can shipwrecks of the 19th century in the Indian Ocean tell us about the climate of the past? And what can the records of these wrecks tell us about climate knowledge production? In her research, Debjani Bhattacharyya, Professor for the History of the Anthropocene at the Department of History at UZH, explores these questions as part of a large-scale project.
“Historical climatology commonly looks at diurnal weather recordings such as weather diaries or farmer almanacs to gather information about the weather and the climate in the past,” says Debjani Bhattacharyya, Professor for the History of the Anthropocene at the Department of History at UZH. But she is interested in completely different sources, she explains: “We call them ‘weather genres’ and by that, we mean all sorts of non-traditional, non-scientific sources which have been ignored so far by historians.” Examples are imperial finances or oceanic trade. “They contain a lot of information about weather disasters e.g., thanks to hail insurance claims,” Debjani adds. While looking for weather genres, Debjani came across the wreck records in the Indian Ocean, produced annually from 1864 to 1940 and containing 700 to 800 pages each, including maps.
The potential of long-term annual maps
Initially, Debjani just studied the maps in the annual wreck records without considering digitising them. She was mainly interested in the records as legal cases since she detected that the clerks who were compiling the cases developed a typology of wrecks: “They distinguished between wrecks and casualties, thus between natural and human causes of the wrecks.” Of course, with her focus on weather and climate, she was more interested in the wrecks.

“It was only when I gave a lecture at the New York University and historian, David Ludden, who was working on Indian ports pointed out that most people did not know that this sort of data existed for the Indian Ocean,” she says. Only then Debjani became aware of the potential that the maps hold: “With climate change playing havoc in the Indian Ocean at the moment, I thought that these records could help to get a picture of the dynamic change over almost 80 years they cover.” She was curious to find out if maps could tell her something more or different compared to the written accounts of these cases: “For instance, what sort of weather events can we glean from these maps? Or is there a preponderance of wrecks in a place I wasn’t expecting?”
Expected and unexpected hot spots
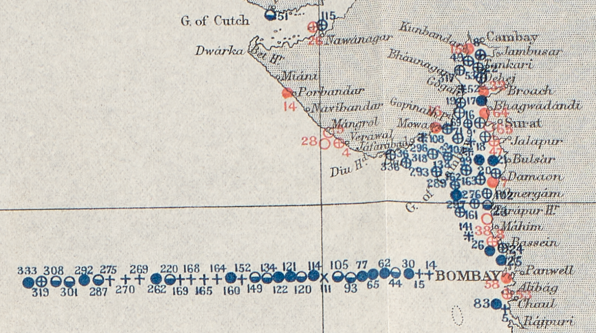
The printed maps for each year in the original record cover the entire Indian Ocean. Each ship is approximately mapped to where the wreck or casualty happened. In some cases, however, there is not enough space on the paper map to locate all the wrecks correctly. The wrecks are then lined up towards the ocean or the mainland (see images below). Additional information on the location and the circumstances of a wreck can be found in the written records.


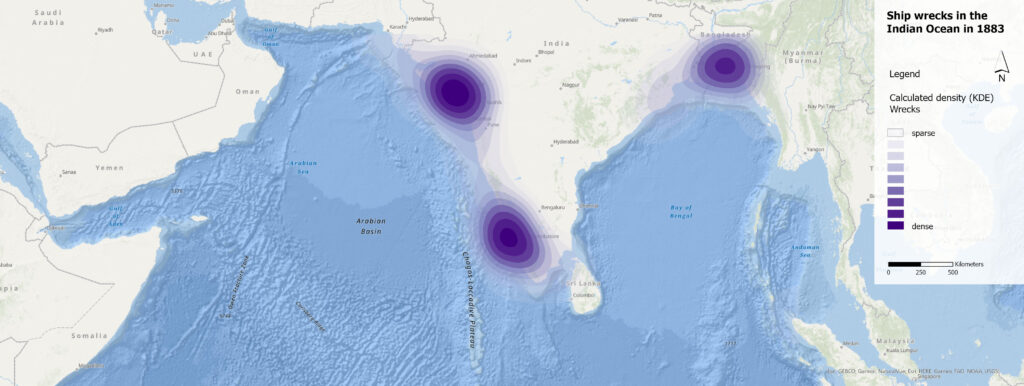
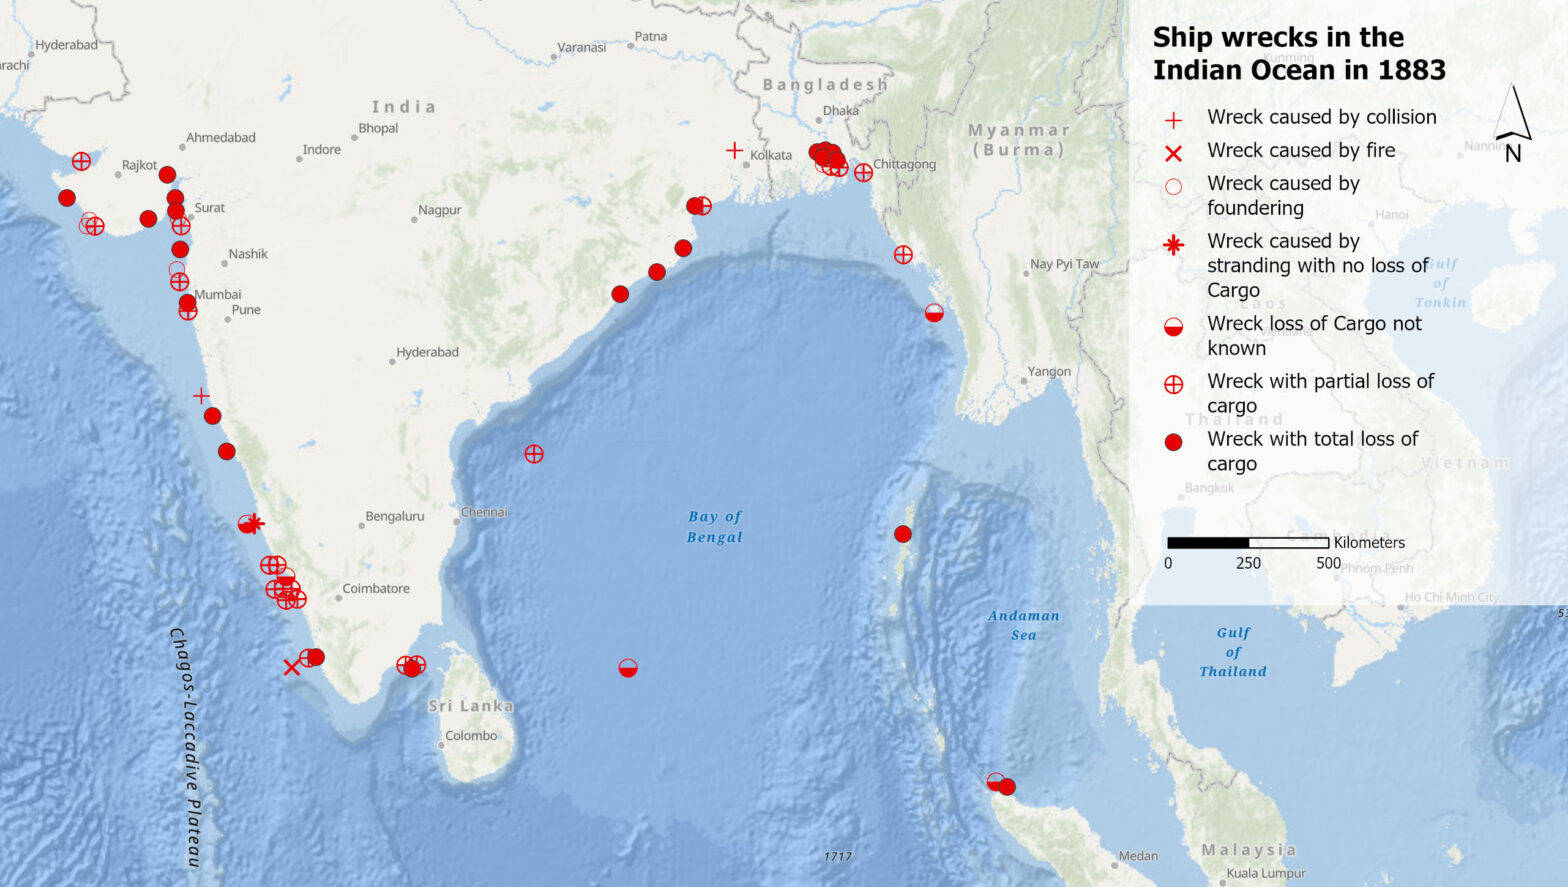
In the beginning, Debjani had no expectations for the digitised map: “I had a clean mind and was curious to know what the digitised maps could teach me about the material I know.” Yet, this changed once she saw the first year mapped in digital form by the GIS Hub (open map in new tab):
Digitised Map of the wrecks and casualties in 1883. To explore the map, please click on the icon with the paper stack to display and hide the different layers. The layers displayed will automatically appear in the legend (data source: The British Library). Open map in new tab.

“There are ports which were really hot spots of wrecks, but which I did not expect at all. I anticipated the major ports of trade, such as Mumbai and Kolkata, to have a lot of wrecks, but on the digitised maps, also smaller ports, most of them on the Western side of the Indian Ocean, came into focus,” she observes. Smaller ports indicate coastal trade as opposed to interoceanic or international trade. What is going on here, Debjani asked herself, why would coastal trade be mapped in this high-frequency area? “I assume that major goods were lost otherwise there would have been no mapping,” she explains. To investigate further the role of these smaller ports, she went to the Bombay Archives.
Reconstruct how knowledge is produced
“After seeing some of the maps in digitised form, I plan to map digitally the wrecks of a few years every decade to see if their number at a certain place is increasing or decreasing,” she says, and adds, “Then it would be interesting to find out the reason for the varying numbers e.g., did the ship technology improve or were there any weather changes or major turbulences? Are there monthly shifts e.g., are there risky areas according to the season? And of course, I am interested in the social, economic and political histories that emerge around the wrecks,” she elaborates.
Debjani’s interest in the maps is twofold: She is not only interested in the wrecks but also in reconstructing how this knowledge was produced: “I want to trace how data-gathering and knowledge production methods were changing precisely when people started mapping the wrecks.” Furthermore, Debjani is interested in their motivation: “I want to find out what they hoped to get out of this information.”
Transversal deep mapping
The wreck maps of the Indian Ocean are just a small puzzle piece in a larger-scale project. “I would like to scale it up with the support of a grant from the Swiss National Science Foundation (SNF) and do a transversal deep mapping,” Debjani explains, and adds, “This means I compare two spaces, the Caribbean and the Indian Ocean, both part of the British Empire, and look at them as connected oceans since knowledge, but also ships and other goods were constantly exchanged.” The comparison is made in terms of nature as an active agent of history, Debjani explains: “The El Niño Southern Oscillation creates a lot of hurricanes and cyclones in the Caribbean Ocean. I want to find out how these weather phenomena impact trade, shipping routes, influenced insurance contracts but also the knowledge production about weather etc.” The decision on the SNF grant is expected in mid-April.
Last but not least, the digitised information should be made available as they are long-term, longitudinal data requested by climatologists, Debjani concludes.
Debjani Bhattacharyya is the Professor for the History of the Anthropocene at the Department of History at UZH. Her research is driven by the desire to understand how legal and economic structures order our conceptualization of environmental transformations and shape how we respond to climate crises. Currently, she is writing a long history of how the marine insurance market’s risk apprehensions shaped weather knowledge, colonial oceanographic sciences and a derivatives market in climate futures in the Indian Ocean Region. She is the director of the Digital History Lab and co-director of the Cultural Analysis Program at UZH.

(photo: provided).
The maps of casualties and wrecks of two different years were digitised by the DSI GIS Hub as part of an interdisciplinary project. This project served as a preliminary study to uncover the potential of digitised maps. Its findings were incorporated into the proposal for the SNF grant.
