You have spatial data and know what you want to analyse, but how do you start? This short tutorial gets you started and guides you step by step through a project setup.
Author Archives: Katia Soland
Using GIS to tackle the SDGs
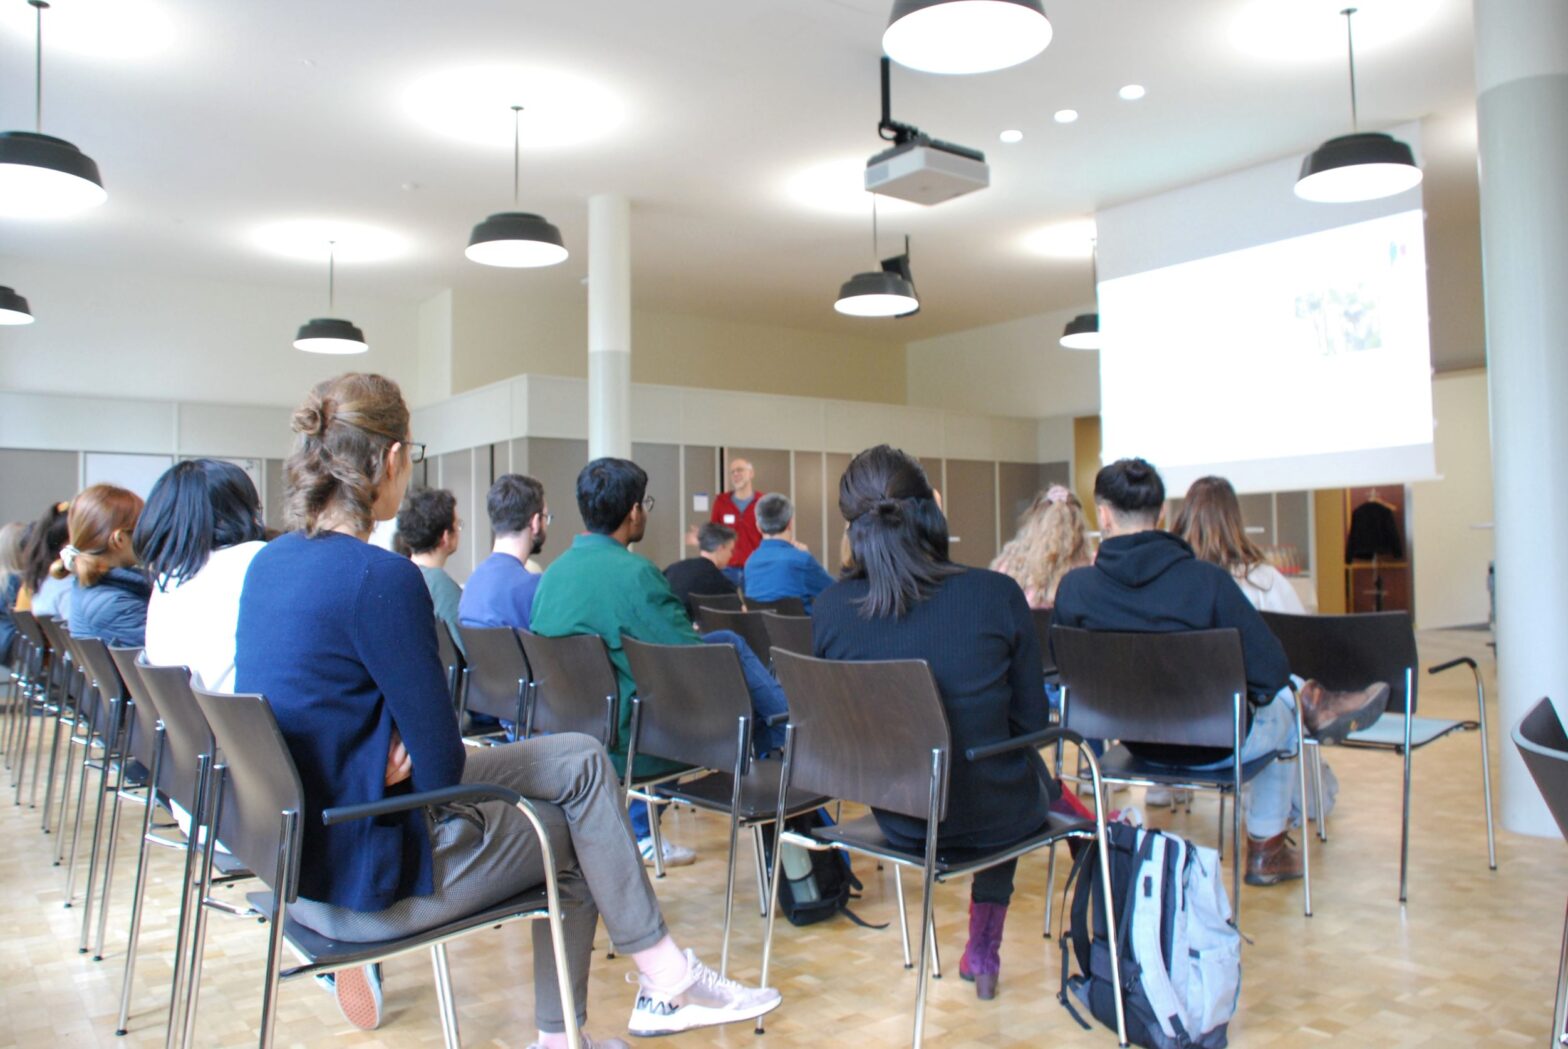
How do companies, NGOs and public institutions monitor their progress towards the sustainable development goals (SDGs), and how can GIS software contribute? Five speakers provided answers from different perspectives at the event “Using GIS to tackle the SDGs”, organized by the GIS Hub and ESRI Switzerland.
“I love to see my data on a map”
As a dialectologist, Carlota de Benito Moreno is interested in how linguistic features change over time and space. By plotting her data on a map and combining it with historical data, she can detect diffusion patterns, divides, or clusters. Sometimes, she even discovers something she did not expect.
A new generation of desktop GIS for the Swiss Parks
This summer, the Competence Centre for Geoinformation (CCG) of the Swiss Parks Network, in collaboration with the Department of Geography of the University of Zurich (GIUZ), organised an introductory training course on ArcGIS Pro for employees of the Swiss parks.
Was uns Ortsnamen verraten
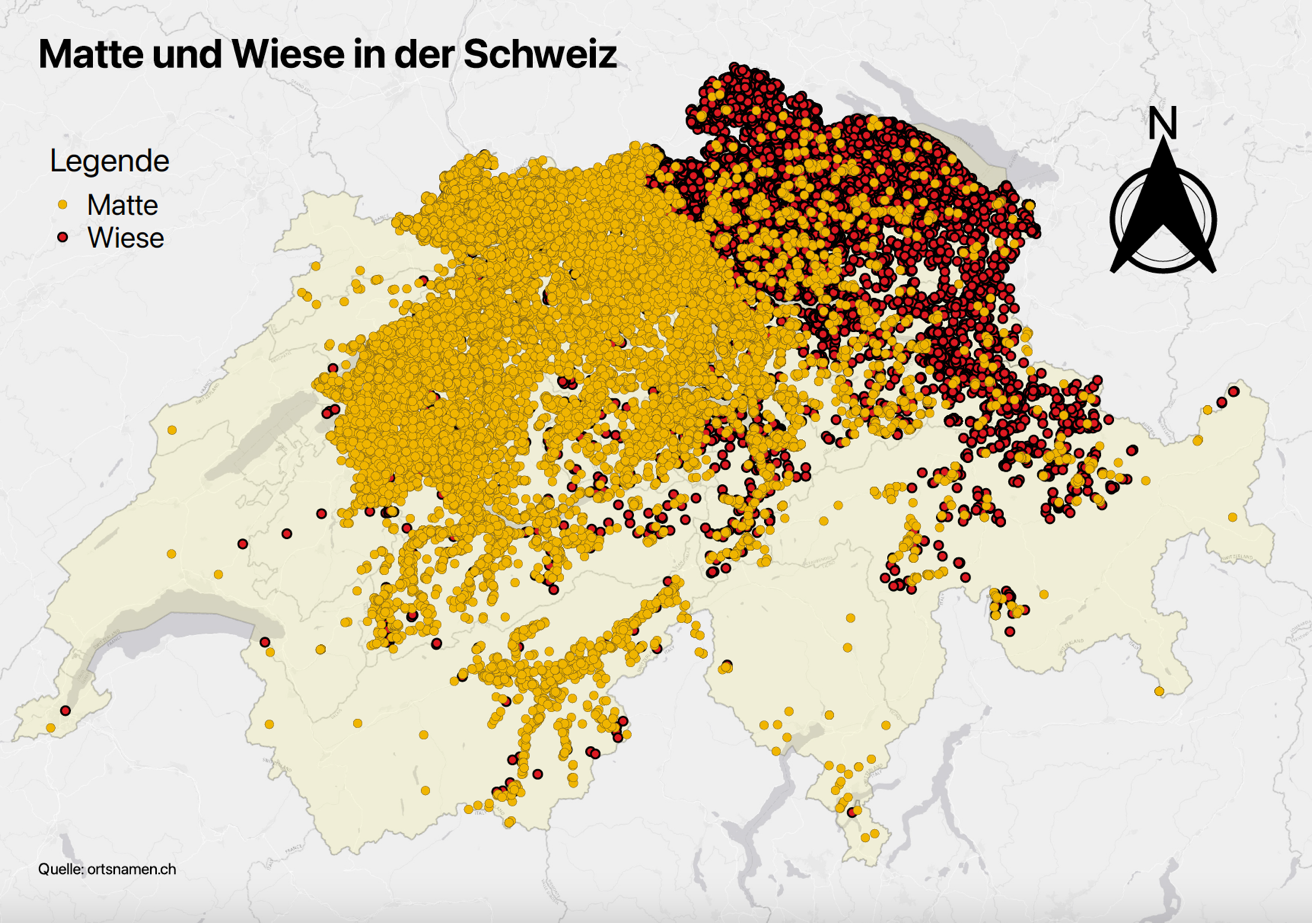
Wie sind Ortsnamen mit «Wiese» und mit «Matte» über die Schweiz verteilt? Wie lässt sich diese räumliche Verteilung erklären? Im Mastermodul «Einführung in die Onomastik» haben sich Germanistikstudierende unter anderem mit solchen Fragen befasst. Die Kartierung hat ihnen geholfen, Muster zu entdecken und Antworten zu finden.
Cholera 1855 in Basel: Between History, Epidemiology and Geographic Visualisation
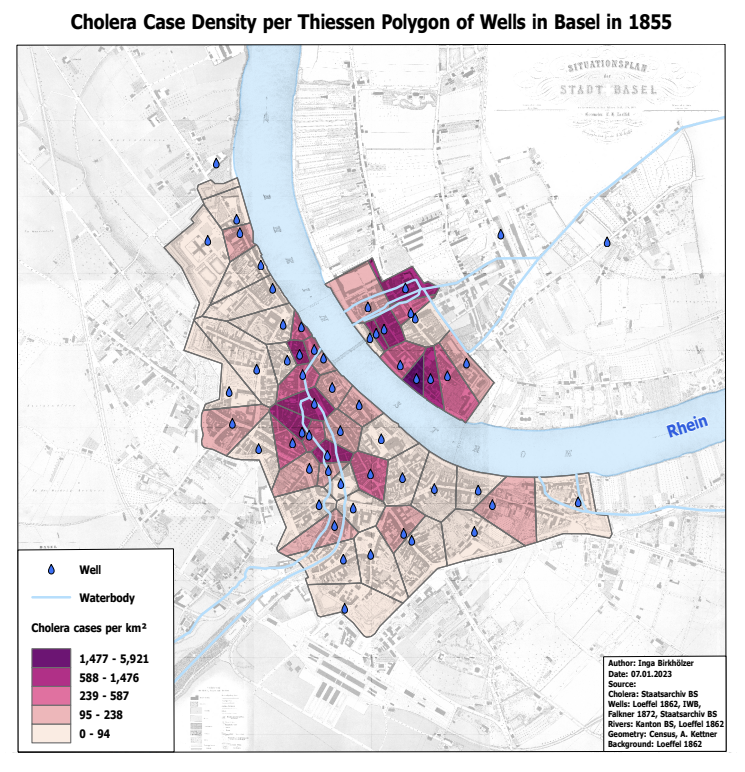
In 1854, Dr. John Snow creates a map of cholera cases in London’s Soho district. He can thus show that the disease is transmitted through contaminated water. In her Master’s thesis, Inga Birkhölzer investigated what can be extracted today from the cholera figures of 1855 in Basel using geographical visualisation.
From background maps and time series to toilet tiles in the national map look
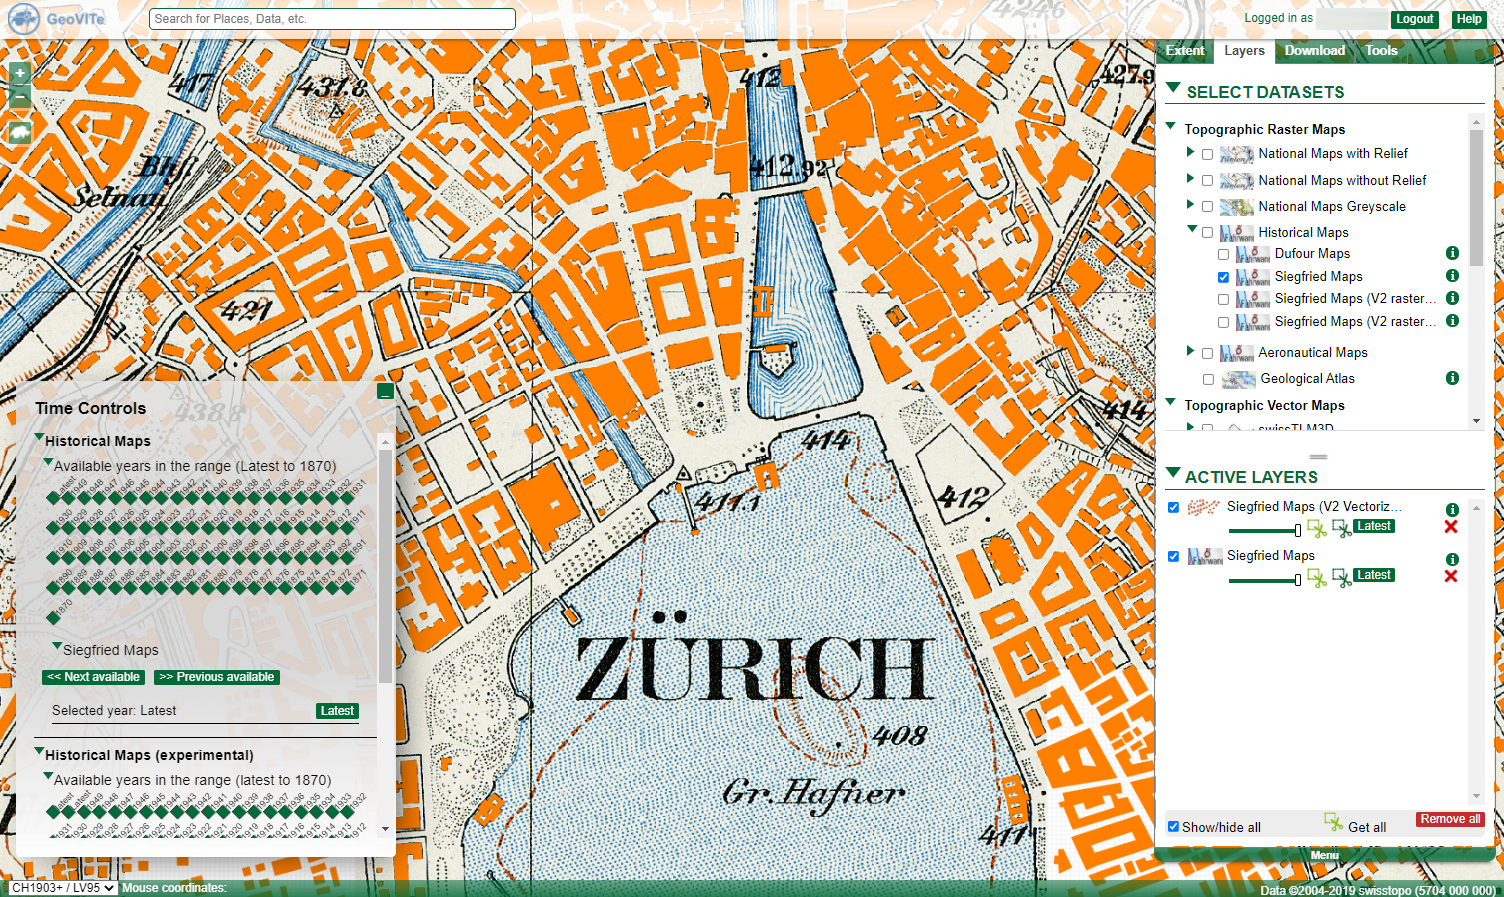
The GeoVITe platform provides topographic raster and vector maps, digital elevation models and orthophotos for research. Roman Walt, who supports and advises the users of the platform, explains in an interview how the data from GeoVITe can be used, what the added value is compared to the data from Swisstopo – and he reveals the funniest request.
Seven reasons to try ArcGIS Online
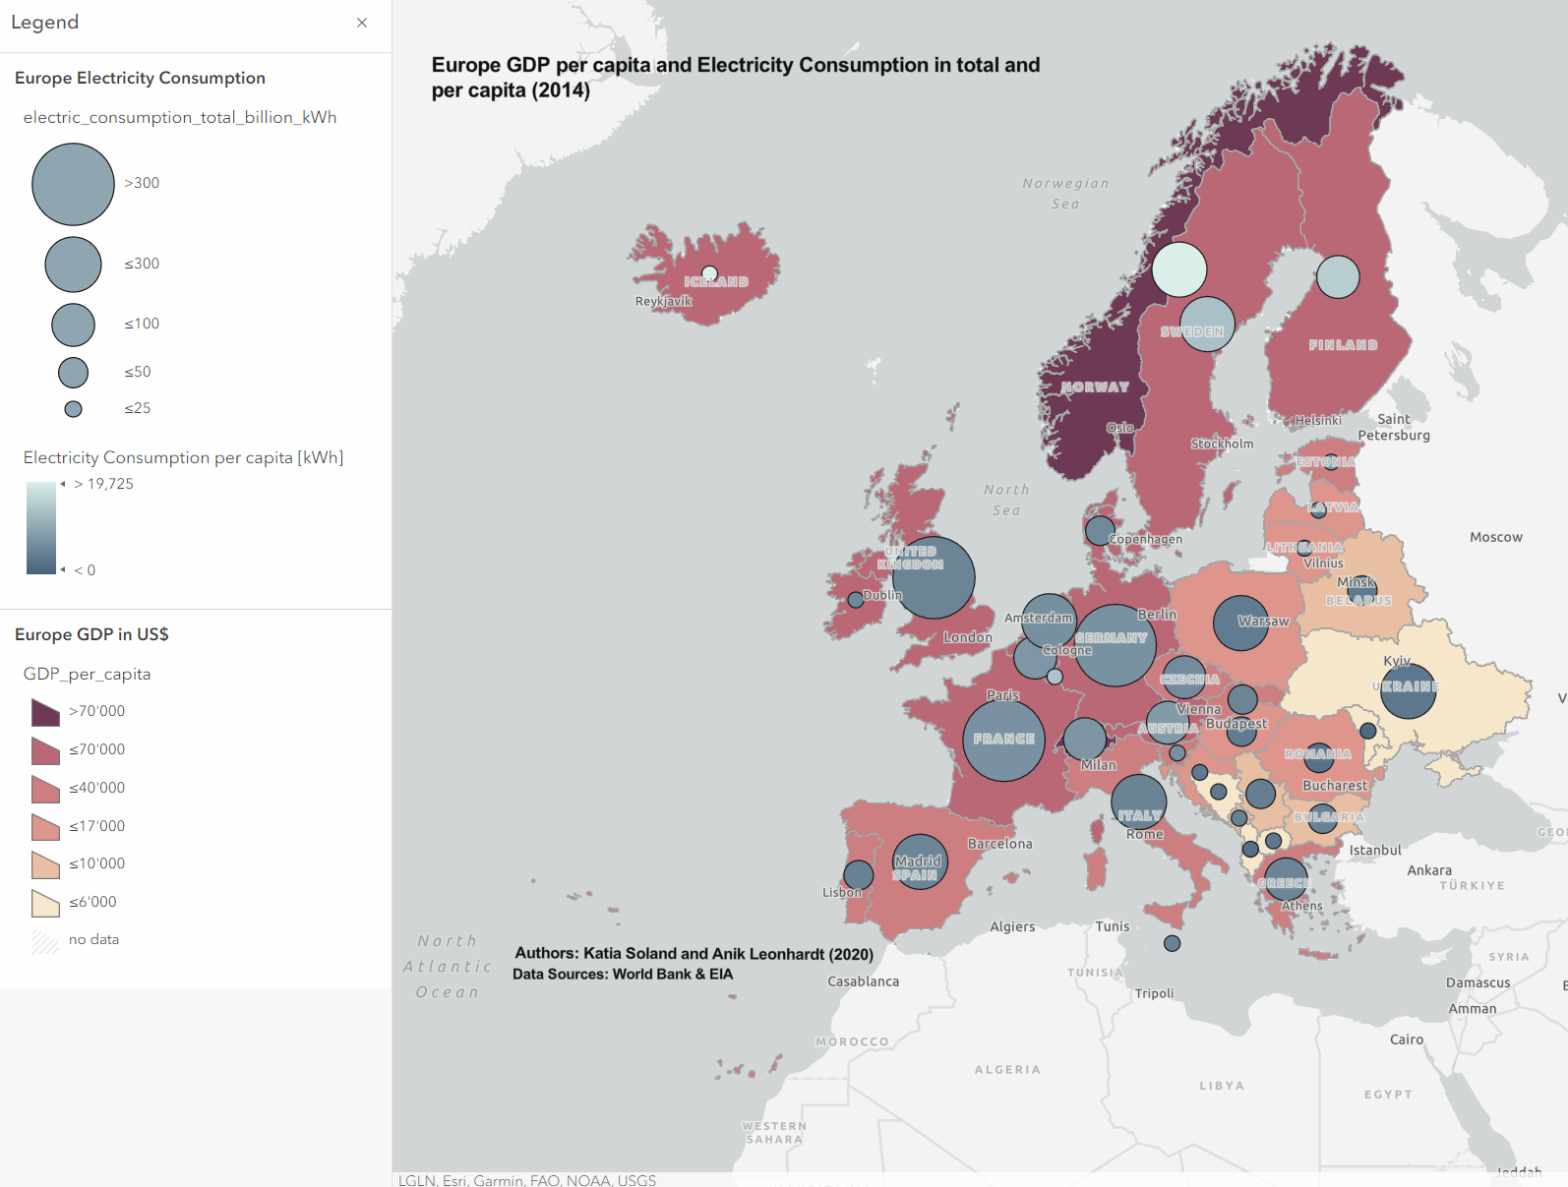
ArcGIS Online is the little brother of ArcGIS Pro, a GIS software developed and maintained by ESRI. We collected seven reasons for you to try out the light version.
QGIS Cloud: Share your maps and geodata
UZH’s QGIS Cloud is ready! In this cloud, students and researchers can publish maps and geodata, share them with others – or get inspired by others. Leyla Ciragan from the GIS Hub explains what the QGIS Cloud is and what you need to know as a user.
GIS Hub officially launched!
On Friday, the 11th of November, we officially launched the GIS Hub together with the participants of the workshop, members of the Advisory Board and the entire GIS Hub Team.


